Rosie Lass
Member Since 2024
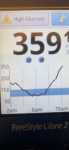
Please help me understand the numbers that I have entered on my spreadsheet versus what you see on the graph. I got a low glucose alarm at 5:24 this morning saying it was 58, Then several readings in the 70s and 80s. I have my graph parameter set at 90 for the low point and 150 for the High Point and nowhere on this graph. Do I see any numbers in the 50s 70s or 80s. I am totally confused and not trusting what I see on this Libre.
To be on the safe side, I did reduce him back to 2.25 but now I’m wondering if I did the right thing
https://www.felinediabetes.com/FDMB/threads/10-23-24-watson-amps-293-libre-209-meter.295150/
https://www.felinediabetes.com/FDMB/threads/10-23-24-watson-amps-293-libre-209-meter.295150/