kimouette
Member Since 2012
Hi everone!
I went to an Excel forum where a very generous man spent some time to create a code that can transform our google spreasheet into 2 graphics.
This is going to work as long as you have Microsoft Excel installed on your computer and the google spreadsheet that shows both "US_MG/dl" and "World MMol/L" thumbnails (I think it's the one called "FDMB World 12/12 Insulin Spreadsheet").
Here is a step by step guide :
1. Go to your google spreadsheet
2. Click File/Download as/ Microsoft Excel
3. Open the downloaded document in Microsoft Excel
4. Add 2 new sheets by clicking the little icon in the bottom of the page
5. Rename each new sheet by double-clicking each one : you need to rename the firt one to "Sheet1" and the second one "Sheet2"
Now to enable VBA macros (Virtual basic macros) to run properly :
1. Select File/ Options and select "Customise the Ribbon" .
2. Select "Main tab" from the dropdown menu, then click "Developer" and click on "add", then "Ok"
3. Now look in the developer tab, click on the yellow triangle "Macro security", tick the last option called "Enable all macros (not recommended, potentially dangerous code can run)", and then click "ok" to close the window
Creating the macro :
1. Still in the developper tab, click on the "Macros" icon, choose a name for your Macro, then click "CREATE" on the right of the window
2. You will now be redirected to Virtual basic's Editor...
3. Erase eveything written in the window and paste the following code :
4. Then Click on "File/Close and go back to Microsoft Excel"
5. Now that you are back to your document, still in the developper tab, select "macros" again by clicking on the second icon
6. You will have 2 choices (one for the glucose chart and one for the insulin chat), Click on the first one and click on "EXECUTE", then click Macros Again, and click on the second one and click "EXECUTE".
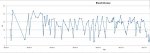
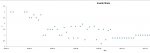
And there you are, Sheet1 now shows the evolution of your dosage, and sheet2 the evolution of your test results!
Make sure you save your document as "xlsm" (which will allow your macros to run). Anytime you add data and dont see the data being updated right away, you will need to execute the macros again (by repeating step 6).
The only thing that pisses me off, is that there is no way we can share that precious Excel file with its macros enabled. Which means that if you need to show your results with someone on the forum, you will still need to keep your google spreadsheet up to date. If you know someone really good in google app script that could translate the VBA code I just shared, it would be great!! Cuz if that was possible, we could only keep our google spreadsheet (have both graphs implemented) and forget about the Excel file!!
I went to an Excel forum where a very generous man spent some time to create a code that can transform our google spreasheet into 2 graphics.
This is going to work as long as you have Microsoft Excel installed on your computer and the google spreadsheet that shows both "US_MG/dl" and "World MMol/L" thumbnails (I think it's the one called "FDMB World 12/12 Insulin Spreadsheet").
Here is a step by step guide :
1. Go to your google spreadsheet
2. Click File/Download as/ Microsoft Excel
3. Open the downloaded document in Microsoft Excel
4. Add 2 new sheets by clicking the little icon in the bottom of the page
5. Rename each new sheet by double-clicking each one : you need to rename the firt one to "Sheet1" and the second one "Sheet2"
Now to enable VBA macros (Virtual basic macros) to run properly :
1. Select File/ Options and select "Customise the Ribbon" .
2. Select "Main tab" from the dropdown menu, then click "Developer" and click on "add", then "Ok"
3. Now look in the developer tab, click on the yellow triangle "Macro security", tick the last option called "Enable all macros (not recommended, potentially dangerous code can run)", and then click "ok" to close the window
Creating the macro :
1. Still in the developper tab, click on the "Macros" icon, choose a name for your Macro, then click "CREATE" on the right of the window
2. You will now be redirected to Virtual basic's Editor...
3. Erase eveything written in the window and paste the following code :
Code:
Dim source As Worksheet, tgt As Worksheet, i%, j%, cob As ChartObject, sr, rn%
Sub Glucose()
Dim col%, frac!, icol
Set source = Sheets("World mmol_L")
Set tgt = Sheets("Sheet2")
i = 3: rn = 2
tgt.Cells.ClearContents


Do While i <= source.Range("a" & Rows.Count).End(xlUp).Row
    col = 2: frac = 0
    If IsDate(source.Cells(i, 1).Value) Then
        For col = 2 To 27
            If col <> 3 And col <> 16 Then
                icol = source.Cells(i, col).Value
                frac = frac + 1 / 24
                If WorksheetFunction.IsText(icol) Then
                    sr = Split(icol, " ")
                    If UBound(sr) = 1 Then
                        If IsNumeric(sr(0)) And IsNumeric(sr(1)) Then   ' cell with two values
                            WriteRows frac - 1 / 48, sr(0)
                            WriteRows frac, sr(1)
                        End If
                    End If
                End If
                If IsNumeric(icol) And Len(icol) > 0 Then WriteRows frac, icol
            End If
        Next
    End If
    i = i + 1
Loop
With tgt.Sort
    .SortFields.Clear
    .SortFields.Add Key:=Range("A1"), SortOn:=0, Order:=1, DataOption:=0
    .SetRange tgt.Range("a2").CurrentRegion
    .Header = xlNo
    .MatchCase = False
    .Orientation = xlTopToBottom
    .SortMethod = 1
    .Apply
End With


tgt.Cells(1, 1).Value = "Date"
tgt.Cells(1, 2).Value = "Glucose Level"
ChartIt xlXYScatterLines, "Blood Glucose", "BG", tgt
End Sub


Sub WriteRows(dt!, ByVal rn2!)


tgt.Cells(rn, 1).Value = source.Cells(i, 1).Value + dt
tgt.Cells(rn, 2).Value = rn2
rn = rn + 1


End Sub


Sub ChartIt(ctype%, tit$, vtit$, tgt As Worksheet)


For Each cob In tgt.ChartObjects
    cob.Delete
Next


Set cob = tgt.ChartObjects.Add(Left:=tgt.Cells(3, 3).Left, Width:=tgt.Range("b2:z2").Width, _
Top:=tgt.Cells(3, 3).Top, Height:=tgt.Range("d2:d32").Height)


cob.Chart.ChartWizard source:=tgt.Cells(2, 2).CurrentRegion, Gallery:=ctype, _
 PlotBy:=xlColumns, CategoryLabels:=1, SeriesLabels:=1, HasLegend:=0, _
Title:=tit, CategoryTitle:="days", ValueTitle:=vtit, ExtraTitle:=""


With cob.Chart.Axes(xlCategory)
    .MinimumScale = WorksheetFunction.Min(tgt.Range("a:a")) - 1
    .MaximumScale = WorksheetFunction.Max(tgt.Range("a:a")) + 1
    .TickLabels.NumberFormat = "dd/mm/yy"
End With


End Sub


Sub Insulin()
' insulin shots
Set source = Sheets("World mmol_L")
Set tgt = Sheets("Sheet1")
tgt.Cells.ClearContents


i = 3:  j = 2
Do While i <= source.Range("a" & Rows.Count).End(xlUp).Row
   If IsDate(source.Cells(i, 1).Value) Then
        tgt.Cells(j, 1).Value = source.Cells(i, 1).Value
        If IsNumeric(source.Cells(i, "c").Value) Then
            tgt.Cells(j, 2).Value = source.Cells(i, "c").Value
            j = j + 1
        End If
        If IsNumeric(source.Cells(i, "p").Value) Then
            tgt.Cells(j, 2).Value = source.Cells(i, "p").Value
            tgt.Cells(j, 1).Value = source.Cells(i, 1).Value + 0.5
            j = j + 1
        End If
    End If
    i = i + 1
Loop
tgt.Cells(1, 1).Value = "Date"
tgt.Cells(1, 2).Value = "U"


ChartIt xlXYScatter, "Insulin Shots", "U", tgt

End Sub5. Now that you are back to your document, still in the developper tab, select "macros" again by clicking on the second icon
6. You will have 2 choices (one for the glucose chart and one for the insulin chat), Click on the first one and click on "EXECUTE", then click Macros Again, and click on the second one and click "EXECUTE".
And there you are, Sheet1 now shows the evolution of your dosage, and sheet2 the evolution of your test results!
Make sure you save your document as "xlsm" (which will allow your macros to run). Anytime you add data and dont see the data being updated right away, you will need to execute the macros again (by repeating step 6).
The only thing that pisses me off, is that there is no way we can share that precious Excel file with its macros enabled. Which means that if you need to show your results with someone on the forum, you will still need to keep your google spreadsheet up to date. If you know someone really good in google app script that could translate the VBA code I just shared, it would be great!! Cuz if that was possible, we could only keep our google spreadsheet (have both graphs implemented) and forget about the Excel file!!